 English
  Deutsch
  Español
  Français
  Italiano
  Русский


Start investigating the Kaggle Titanic example and creating Excel data mining formula in one click with NeoNeuro!
Download NeoNeuro, unzip and run setup. Open NeoNeuro Data Mining application:
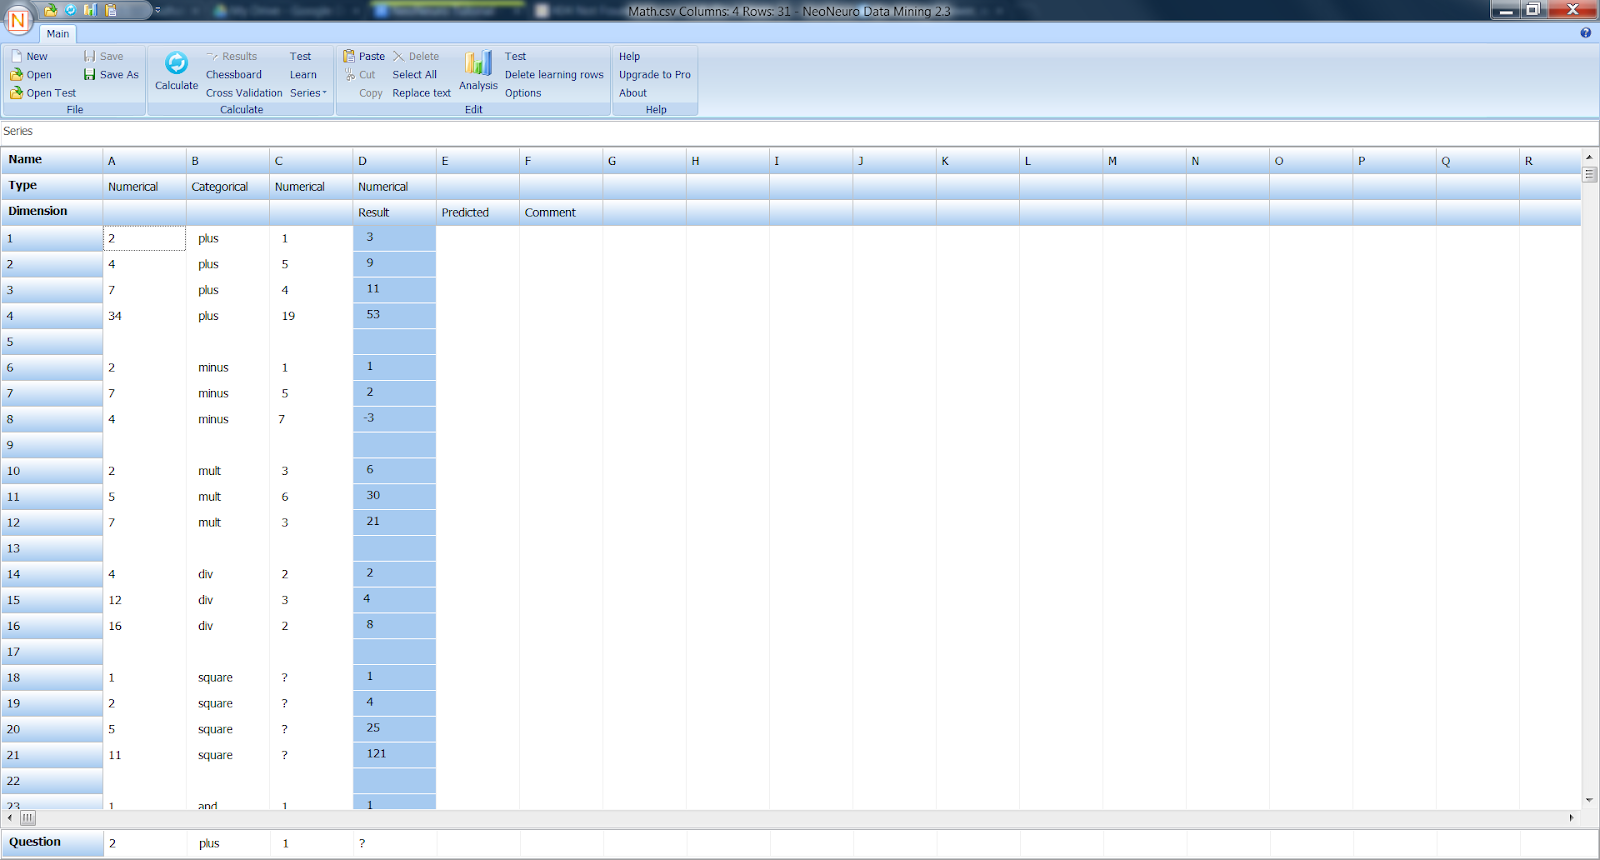
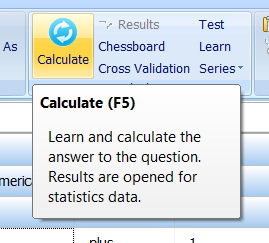
Application automatically opens example of elementary math machine learning. Here you can click Calculate button to see results, change the values and Calculate again.
But in our tutorial we investigate Titanic data mining competition from Kaggle.
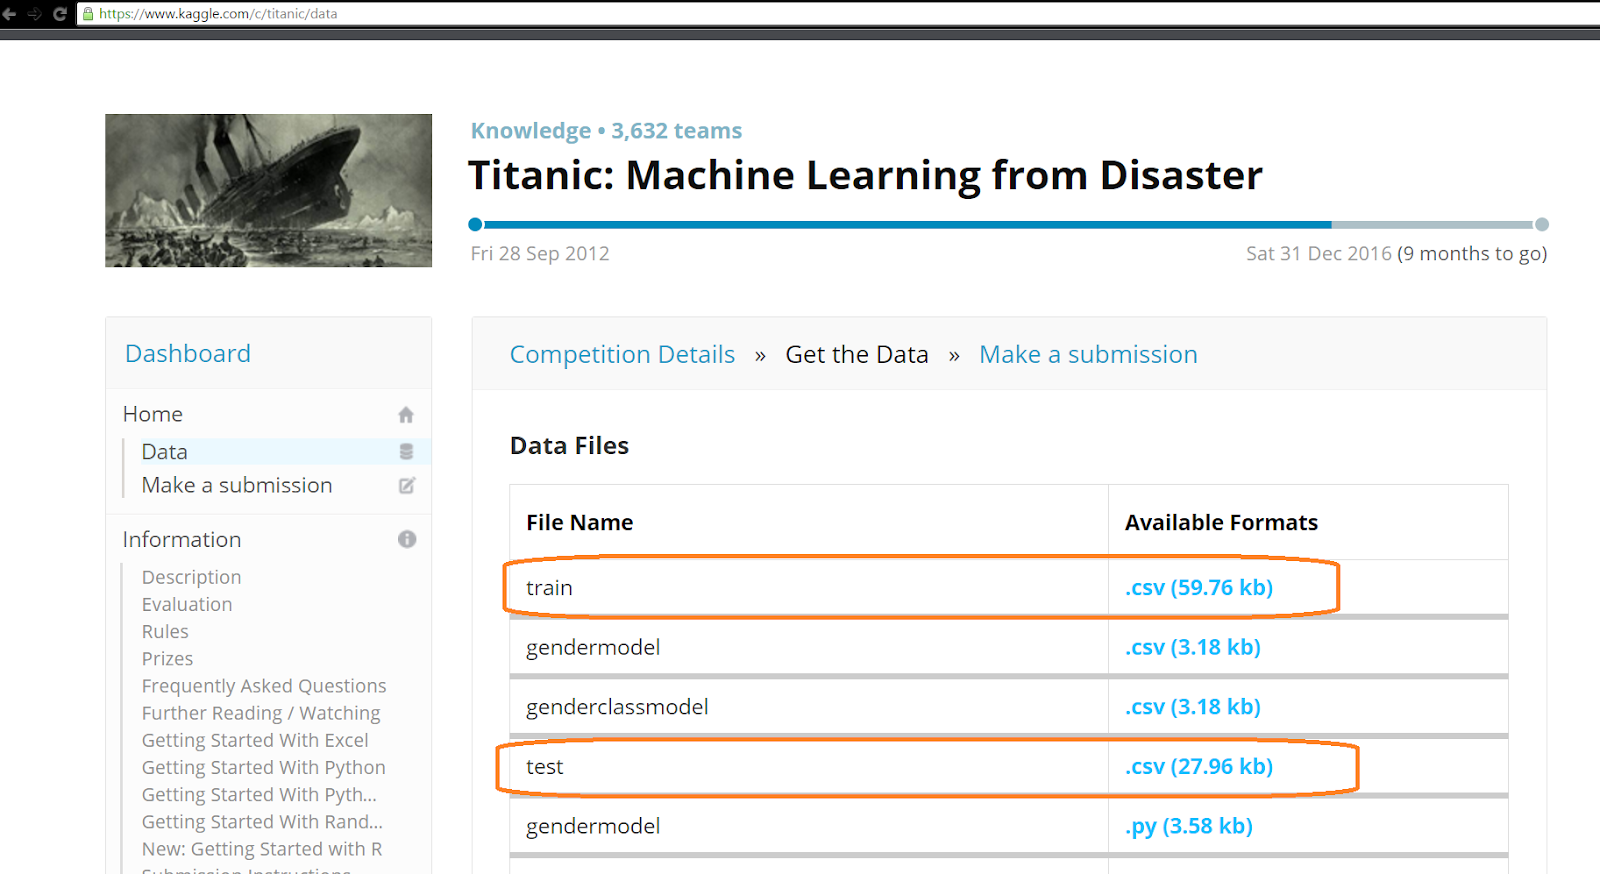
Open page https://www.kaggle.com/c/titanic/data
and download train.csv and test.csv (instead of downloading you can use Documents\NeoNeuro Data Mining\Examples\Titanic.csv example):
Open Train.csv in NeoNeuro by running Open dialog or by drag-n-drop from file Explorer.
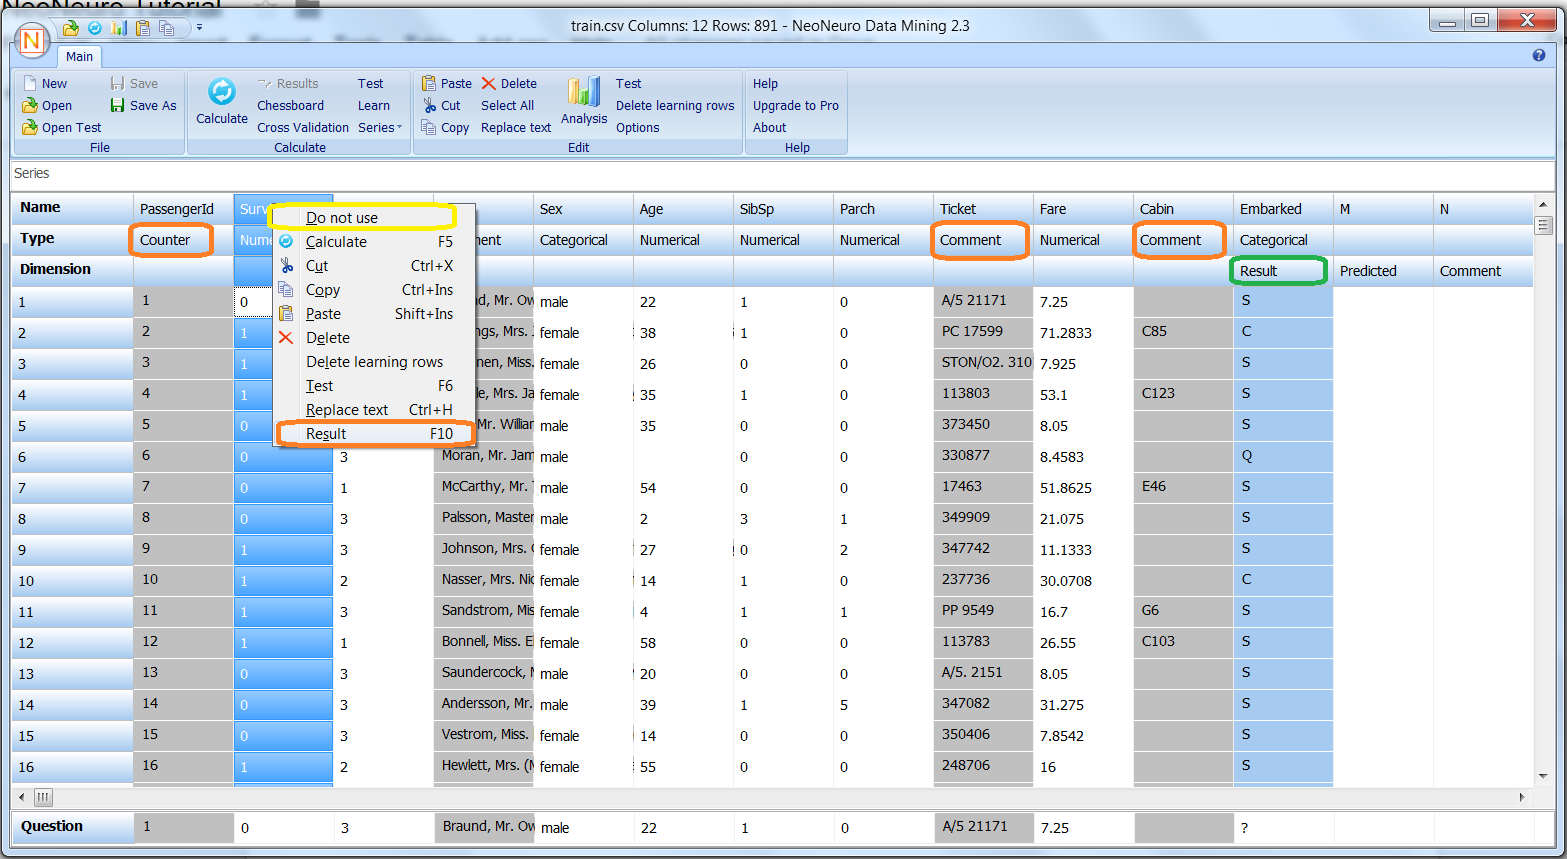
NeoNeuro automatically suggests to divide parameters (columns) into important and unimportant and uses the last parameter as a result.
Grey columns are parameters which will not be used in analysis. You can change it in context menu by click on “Do not use” button - it is marked with yellow in the screenshot. Look at the Type row (second row in the greed) - here NeoNeuro writes the type which is also automatically detected and can be changed by user. Counter and comment types are supposed to be not important. Categorical and numerical types are detected for convenient work. Numerical parameters are separated in clusters.
Result (or label) is always the last column, it is marked with Green here. In Titanic result column is “Survived” which is the second by default, so please click with the mouse on the title “Survived” and select “Result” in context menu like it is shown in the screenshot.
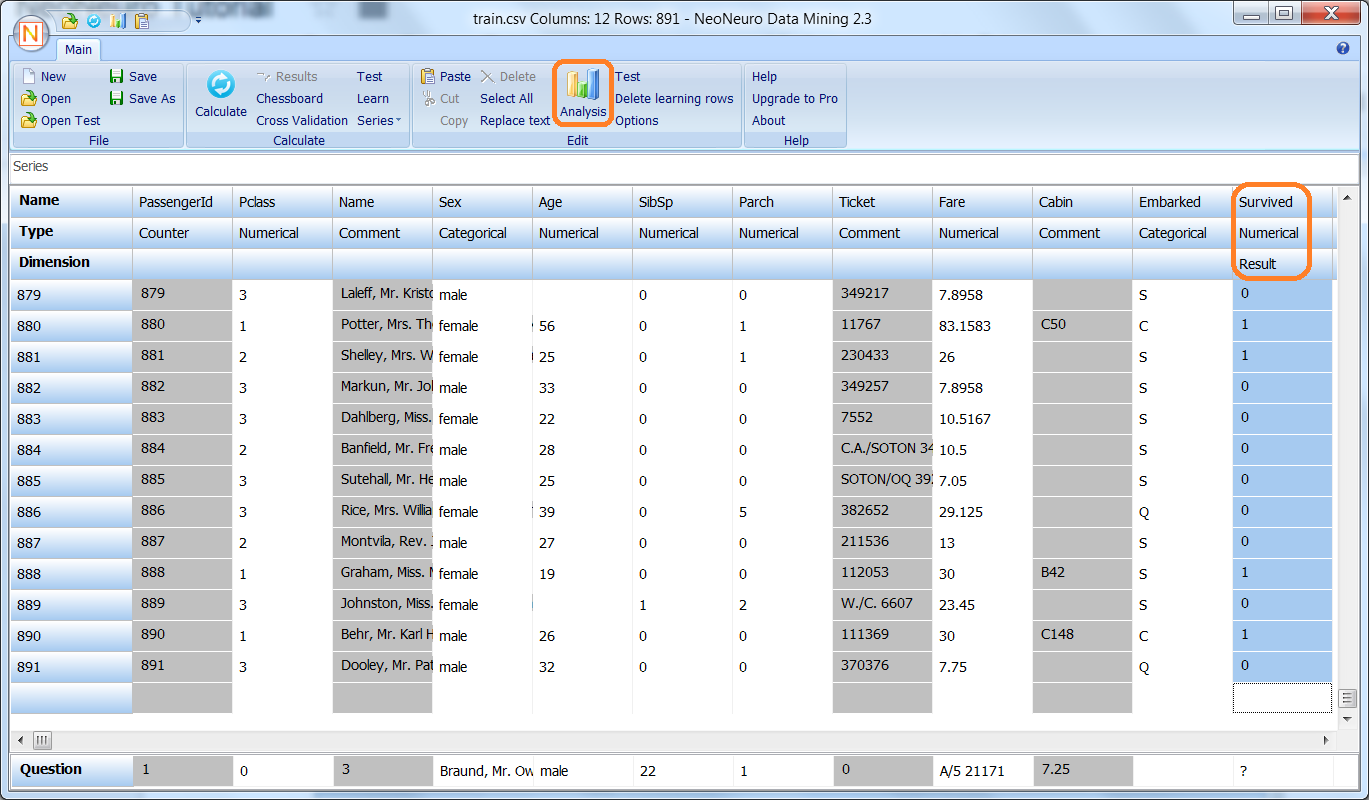
Press on the analysis button. This is the only click you need to do!
In fact in this example we changed Result parameter, this is another click, but in many examples Result column is the last by default and one click is really enough.
NeoNeuro has innovative data analysis which in one click calculates the most important parameters, visually shows the influence of each value of each parameter in the final result and even generates Excel formula which can be used in your business processes or science researches.
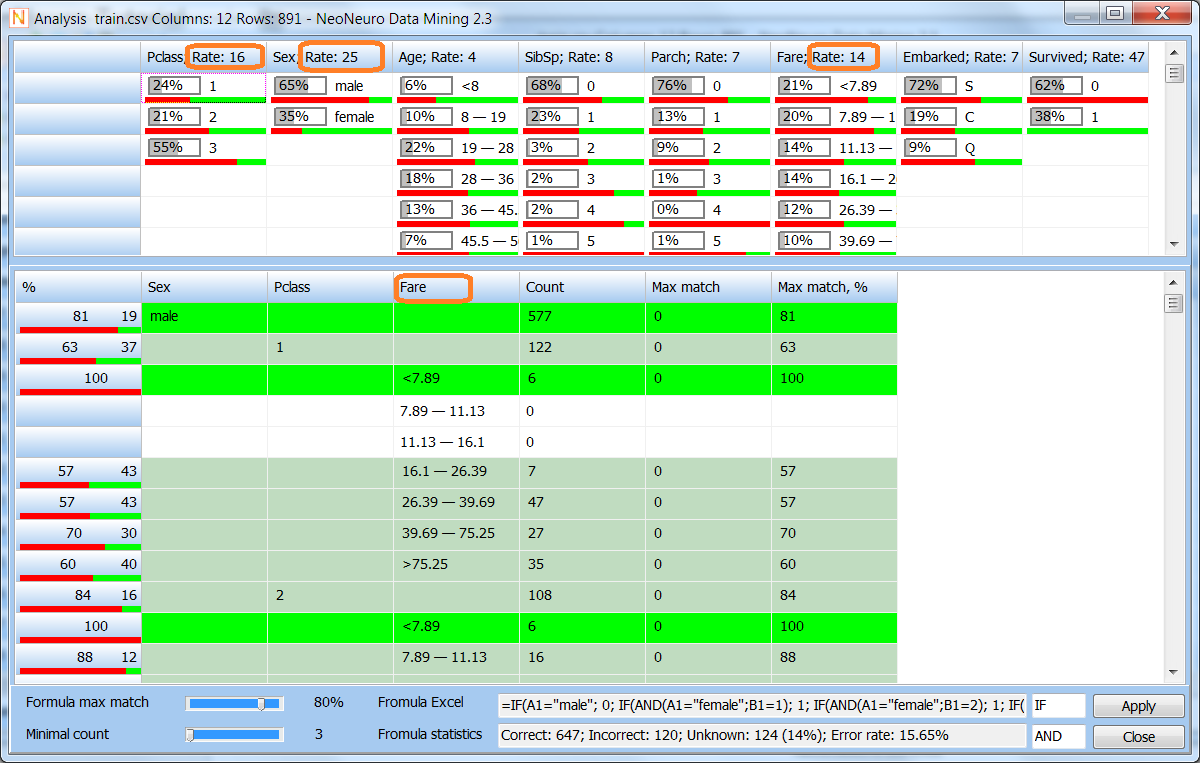
NeoNeuro automatically calculates rates of importance of each column, you can see the most valuable columns with orange marks in the top grid. These three columns are automatically used for formula creating in below grid. Fare depends on Class, so click on Fare and press “Delete”, the below grid will look like in the following screenshot.

Analysis window has two grids separated by moving splitter and settings which work with the lower grid.
Top grid describes all the parameters and their influence to the result (label).
Lower grid shows up to 3 parameters and makes “Tree” from them to show the influence of each “leave” to the result. Settings below allow to visualize the lines in lower “Tree” greed to show the most valuable lines. Also in the lower panel you can find Excel formula. It is copied automatically into the clipboard.
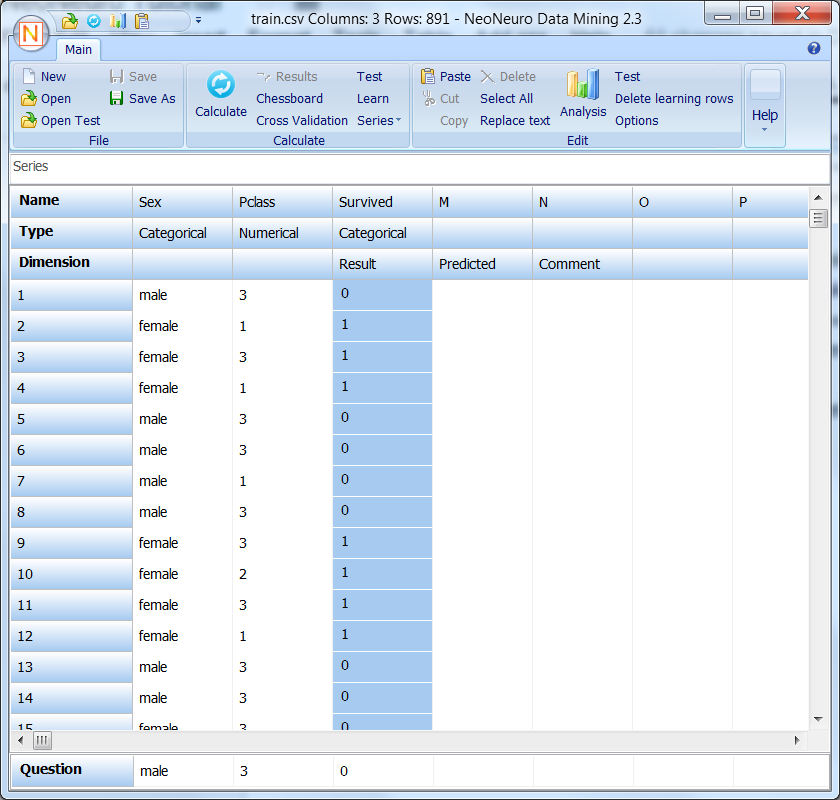
Apply button closes the window and leaves selected columns only. You can copy/paste them to Excel to work with formula.
Click “Apply” button.
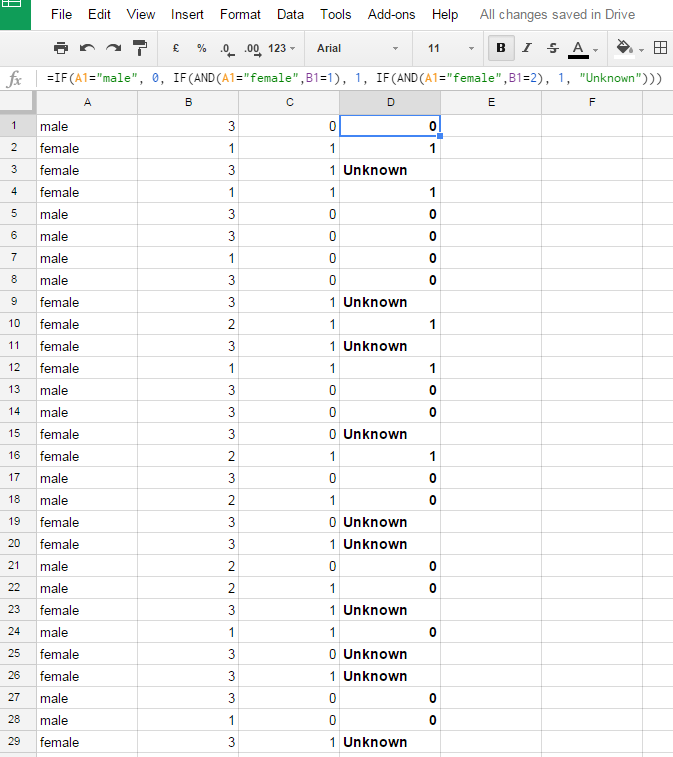
Open Excel (or Open Office or similar spreadsheet which supports formulas) and paste formula to the first row, column D (the formula is already in clipboard, if not please press Analysis again). You will see “Unknown” there, this value is written by formula if it cannot give the exact answer. You can change this Unknown inside the formula.
=IF(A1="male"; 0; IF(AND(A1="female";B1=1); 1; IF(AND(A1="female";B1=2); 1; "Unknown")))
Note for non-English Windows / Excel: IF and AND are translated in local non-english versions of Excel so set translations in the corresponding edits of NeoNeuro Analysis window to create the formula for your Excel version.
Return to main NeoNeuro window and Select all (Ctrl+ A” or Edit>Select all), copy to clipboard and paste to the Excel, in the cell A1.
Double click in formula cell, in right bottom:
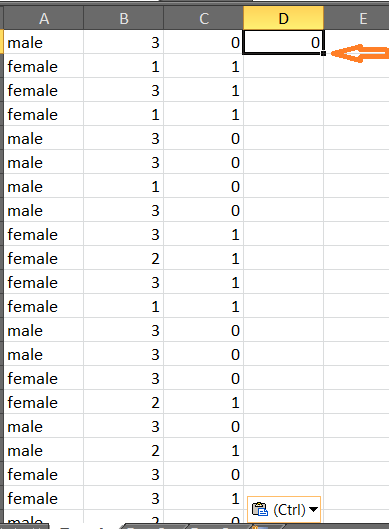
the formula spreads till the end and you will see the predicted results.
The same formula works also in Open Office and other spreadsheets. The following screenshot is made in Google Docs:
We learned the easiest way of generating data mining formulas for Excel. Let us return to NeoNeuro Data Mining Analysis tool to understand how NeoNeuro helps in preliminary data analysis, for instance for further implementation in Python or R.
Open train.csv again.
Set “Survived” to be Result parameter and open “Analysis” tool.
This screenshot shows a lot of analysis information which is easy to access in one window.
We can find:
-
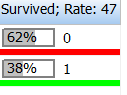
A lot of visual charts, here green means survived and red - not survived. Colors can be found in top grid, last column (result).
-
Influence of each value in each parameter. For instance, put the mouse at the age <8
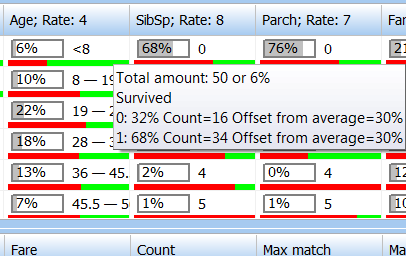
Hint shows:
-
total amount of children less than 8 years, it is 50 persons or 6% from all the people in this dataset.
-
Each value is investigated on its influence to Survived parameter. Here we see that Survived=1 was for 34 cases or 68%. This is 30% more than “normal” survival value which is 38%, you can find in in the last column:
-
Rates of each parameter show the influence of the parameter on the result.
-
Bottom grid allows to investigate the “tree” of some combined parameters with it influence to the result. The same charts are shown for each combination as in the top grid.
-
By default below grid uses 3 parameters which have the highest rates. You can change them to any parameters you need,drag-n-drop them, delete them.