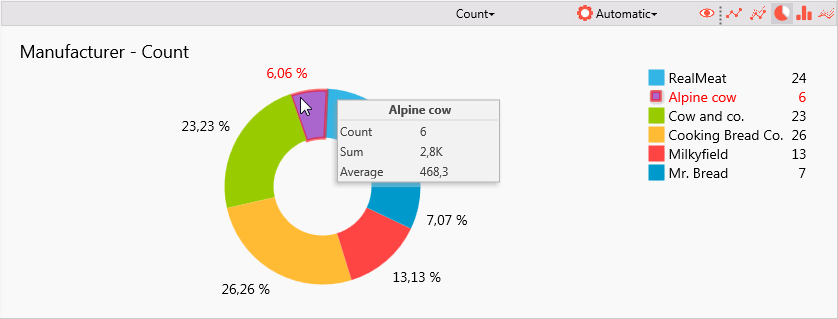
Select in Ribbon: Chart -> Settings -> Count, click on “Manufacturer” column header and pie chart will show shares on base of counts.
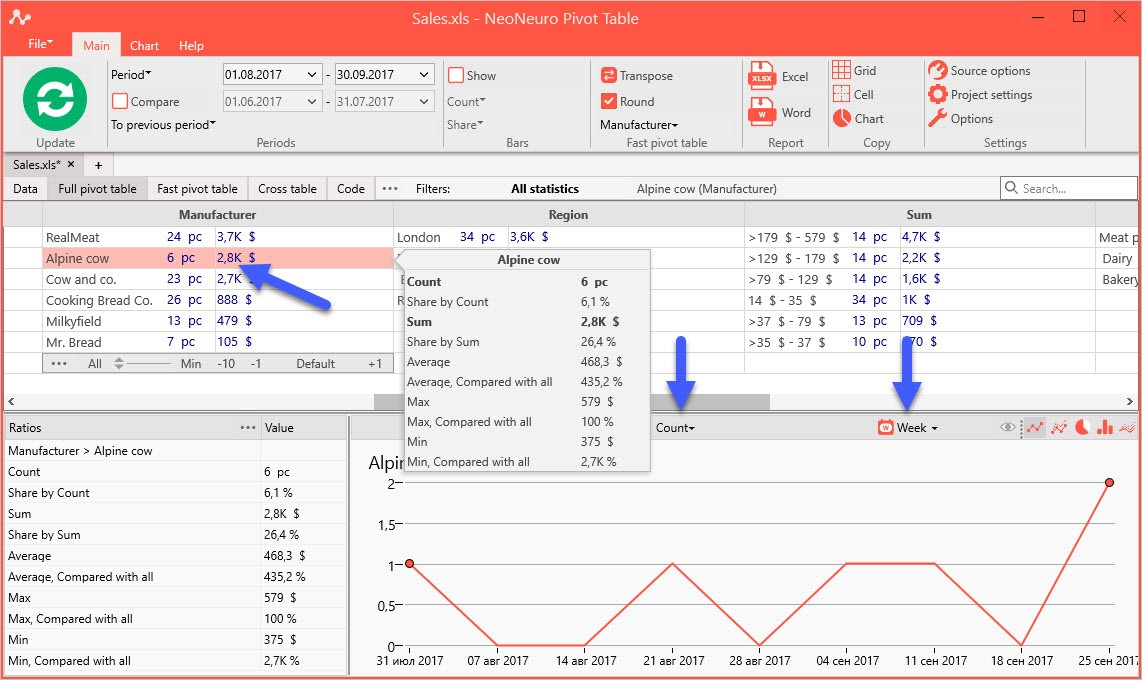
Here we see that “Alpine cow” despite of low count 6% gives 26% of sales.
If we choose “Alpine cow” and period – week, then chart will be shown like this:
We see chart for counts. There are some weeks with one or two sales and others are without sales.