The “Conversion” function shows how some parameters affect others.
For example, the count of successful transactions and the percentage of total transactions for a given cell.
Conversion can be used for:
· analysis for any parameters within the table;
· tracking the implementation of the sales plan;
· settlement profitable and unprofitable products;
· finding companies with low sales in various price and product categories;
· finding depressed regions;
· business optimization for various parameters.
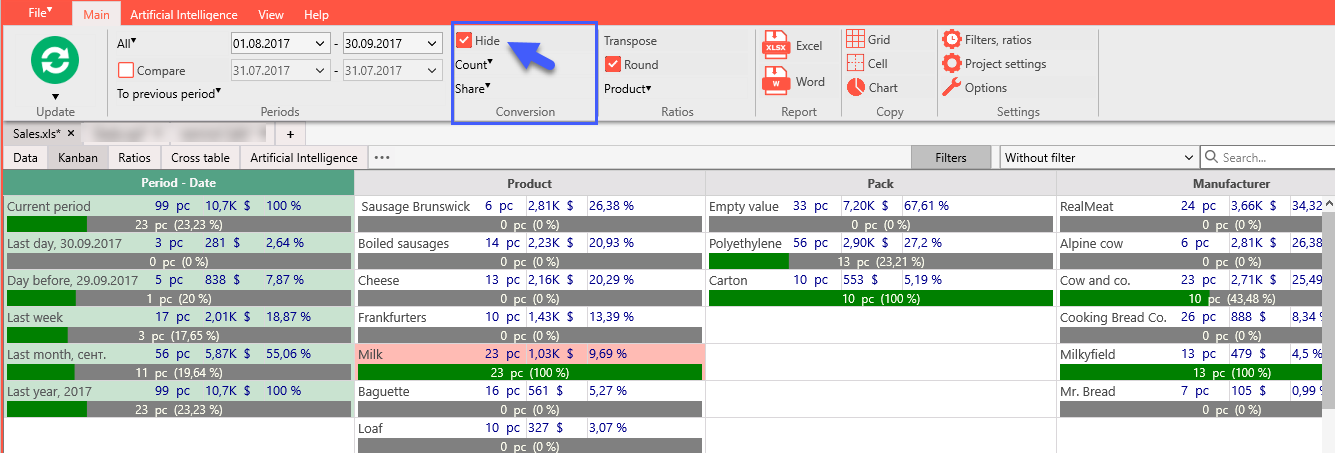
Select the box "Hide" in the Main menu as in the picture.
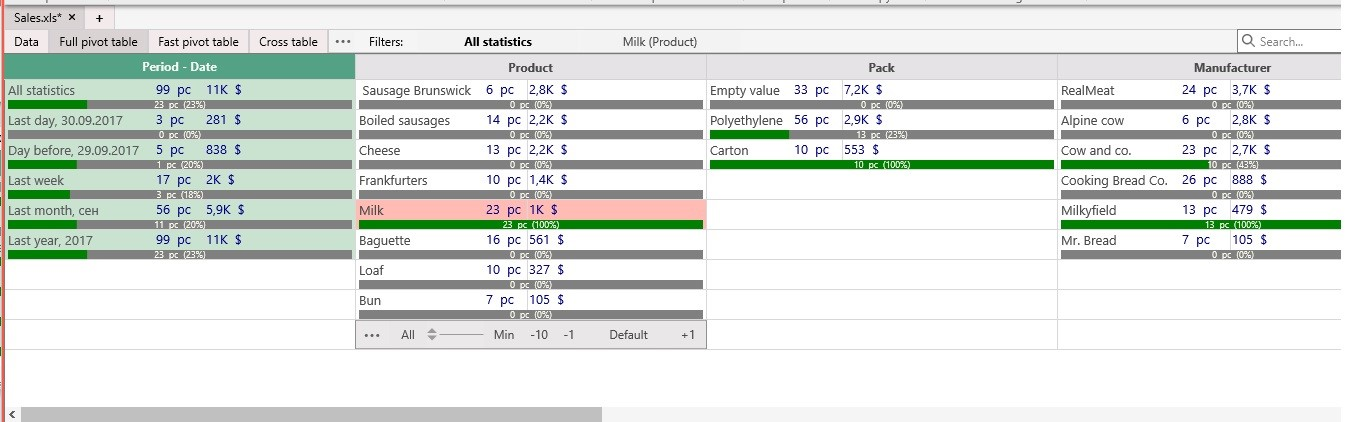
When Conversion are turned on, the Conversions appear under each as green-gray diagrams. Conversion show Share or Allocation of the selected cell in the other cells. On the screenshot above we can see that Boiled sausages has 14% share in All statistics, 42% share in Pack -> Empty value and so on.
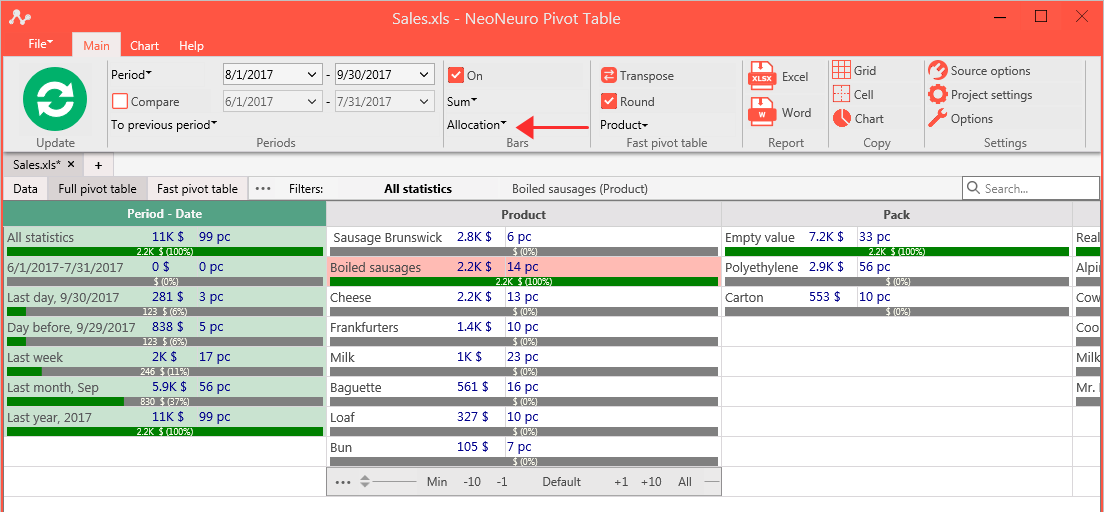
Select Conversion -> Allocation and analyze where the Boiled sausages are sold. You can see that All statistics shows 100%, that means that ALL of Boiled sausages were sold in “All statistics”. 11% of Boiled sausages sales are in the “Last week” and so on.
There are two settings in Conversion (Bars).
Sum or Count:
Share or Allocation:
Examples of data analysis on the functional "Conversion" ("Bars"):
1. Conversion for the column “Period-Date”
If we choose the value of the parameter “Last day 09/30/2017” and “Day before 09/29/2017” we will see a percentage of the total count of products sold during these days.
2. Conversion for the “Product” column
If we select a cell in the “Product” column, we will see which manufacturers have supplied this product, the packaging that this product uses, the sales structure by region, price ranges, etc.
3. Conversion for the column "Manufacturer"
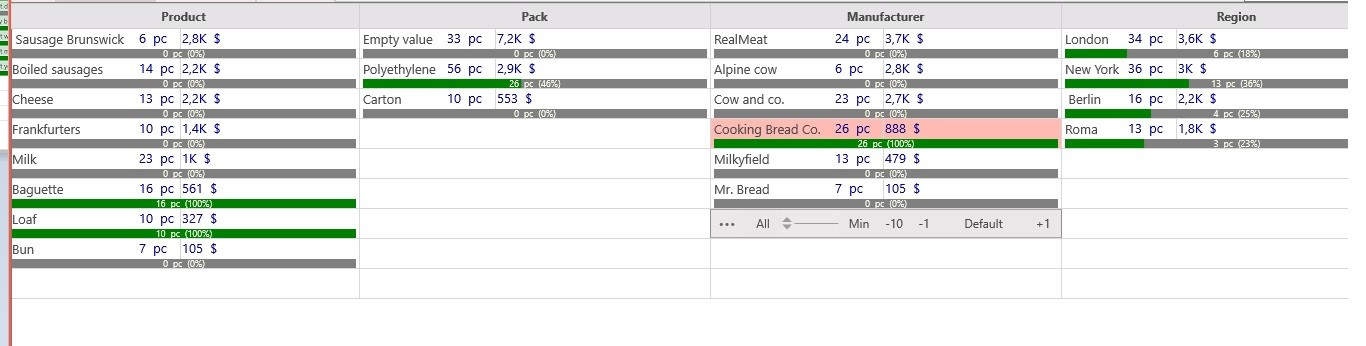
If we select a cell in the column “Manufacturer”, we can see what commercial products the manufacturer supplies, the general structure of the product range of this manufacturer in the total volume of all sales of the manufacturer.
4. For tables Bitrix 24
Having the necessary data on leads, employees, utm-tags, we can accurately calculate the sources of qualitative leads and those responsible for their implementation.
If we have data on employee schedules, we can find out who fulfills the sales plan more.
Conversion help to make a detailed analysis in the count and amount, structural shares and distribution of each parameters in the context of other parameters.
Use Conversion to improve your business, promptly discard unprofitable products or transactions, and increase profitable ones.