Cell consists of a group of the same values in a parameter (column). For instance, we have parameter ”Pack”, and “Carton” is a cell.
There are some special cell:
“Others” – cell combines all values, which are not included to important ones;
“Empty value” – cell consists of cases where parameter has no values;
Search cell – consists of all values from a parameter, where the search text included.
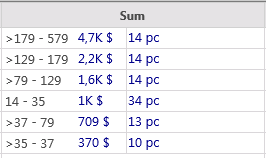
Numerical segments – numerical values divided to groups and can be used for price analysis. The following picture shows sum segments with their ratios:
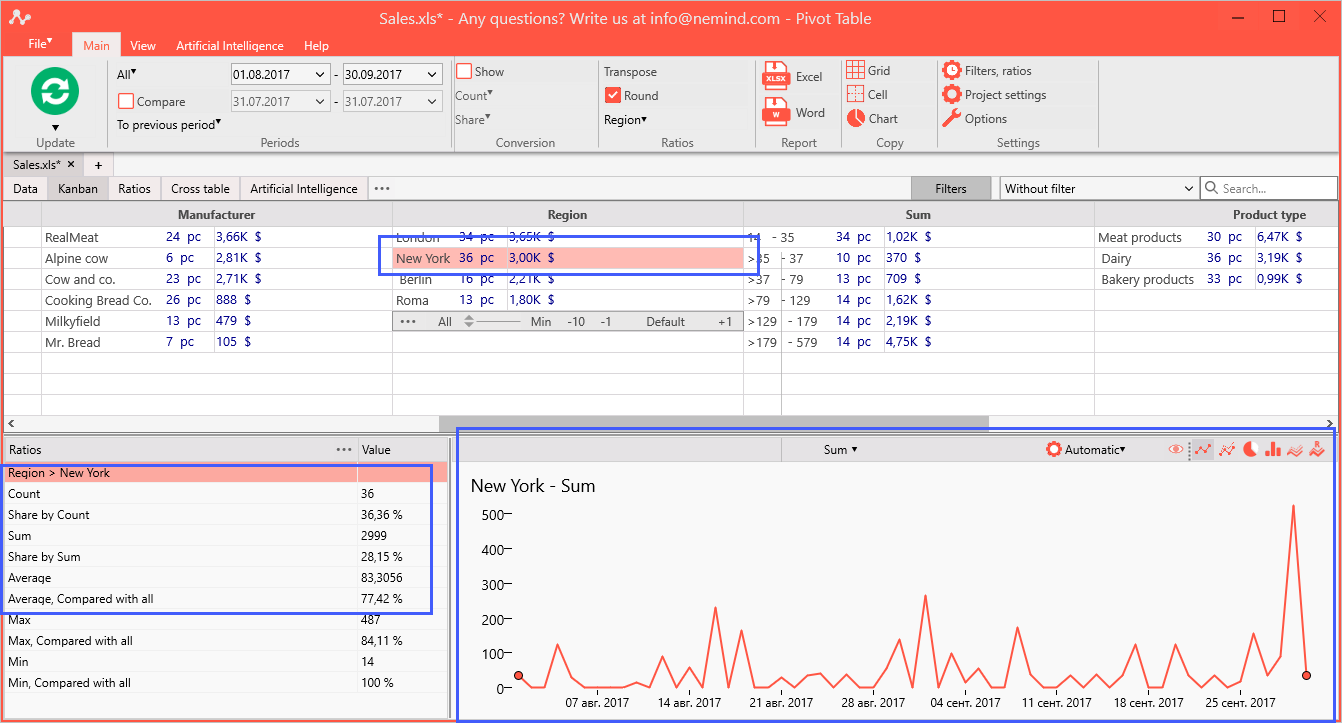
If we click on “New York” in column “Region” we see that chart is changed and shows data only for cell “New York”.
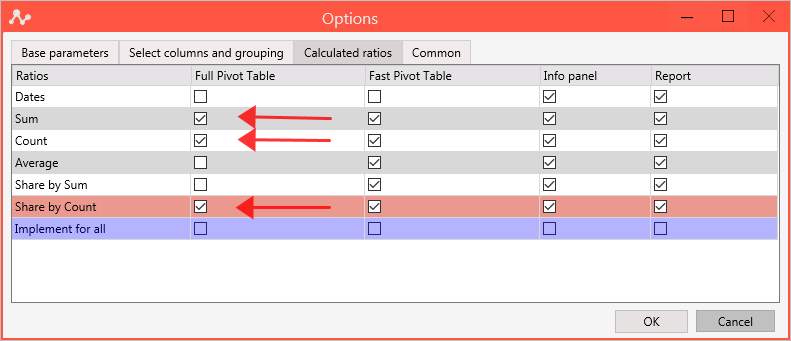
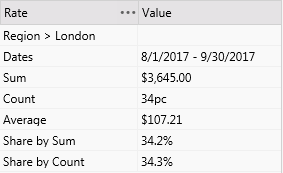
Each cell shows name and ratios which can be adjusted in Main -> Settings ->Calculated ratios.
By default, each cell of Kanban has the following ratios:
Name | Sum | Count | Trend by sum
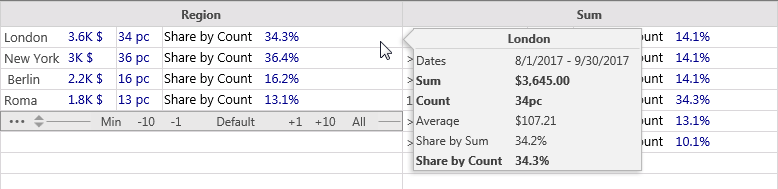
For example:
London |3.6K $ |34 |+183 $ (+10.6%)
Information panel in bottom left stored by default much more ratios.
Ratios inside cells are convenient for fast analysis and comparison of some ratios simultaneously.